development
The unequal commute
October 6, 2020
How do you show not just how far potential workers are from jobs, but how difficult (and likely) it is for them to get there?
This quick turn feature highlights a new way to measure equity in transportation planning that considers just that issue: access to jobs.
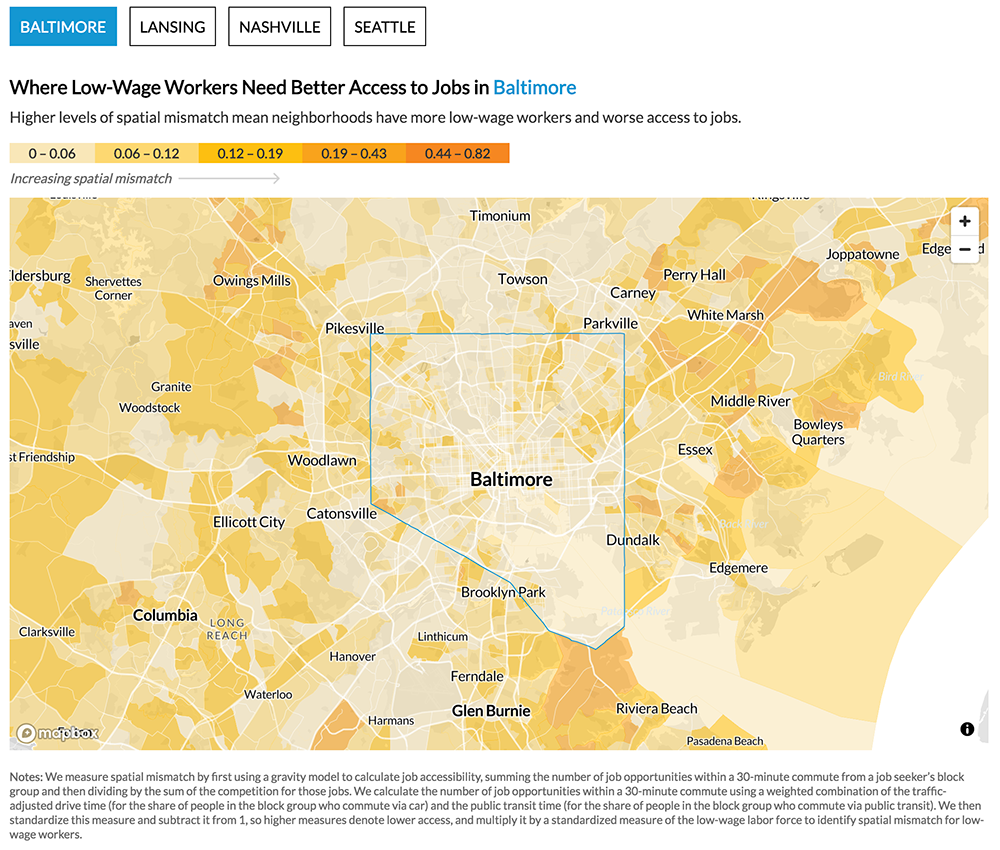
Our challenge as the comms team was to make this complex measure easy to understand. A choropleth map is great for spatial data and worked well here to highlight the problem areas leaders should target with more funding.
We also needed to make it easy for a reader to find a particular neighborhood on the map. The data is calculated by Census block group, not very intuitive for most people. Mapbox, with its built-in layer of roads and landmarks, was a great solution. Making that base layer visible through the data overlay required a lot of careful thought and experimentation with color, opacity, and layering.
The end result is a beautiful, textured map that’s easy to navigate and clearly identifies neighborhoods in need of additional transit.